Figure 4.

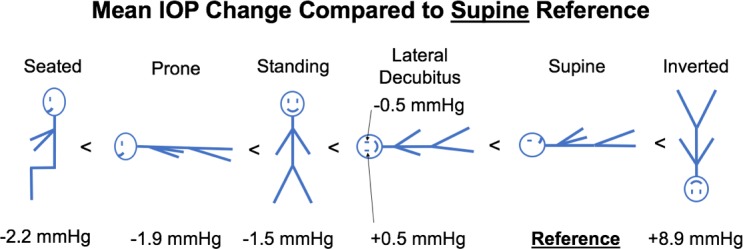
Diagram with different body positions and mean IOP change from supine position, ordered from negative change (left) to positive change (right).

Diagram with different body positions and mean IOP change from supine position, ordered from negative change (left) to positive change (right).