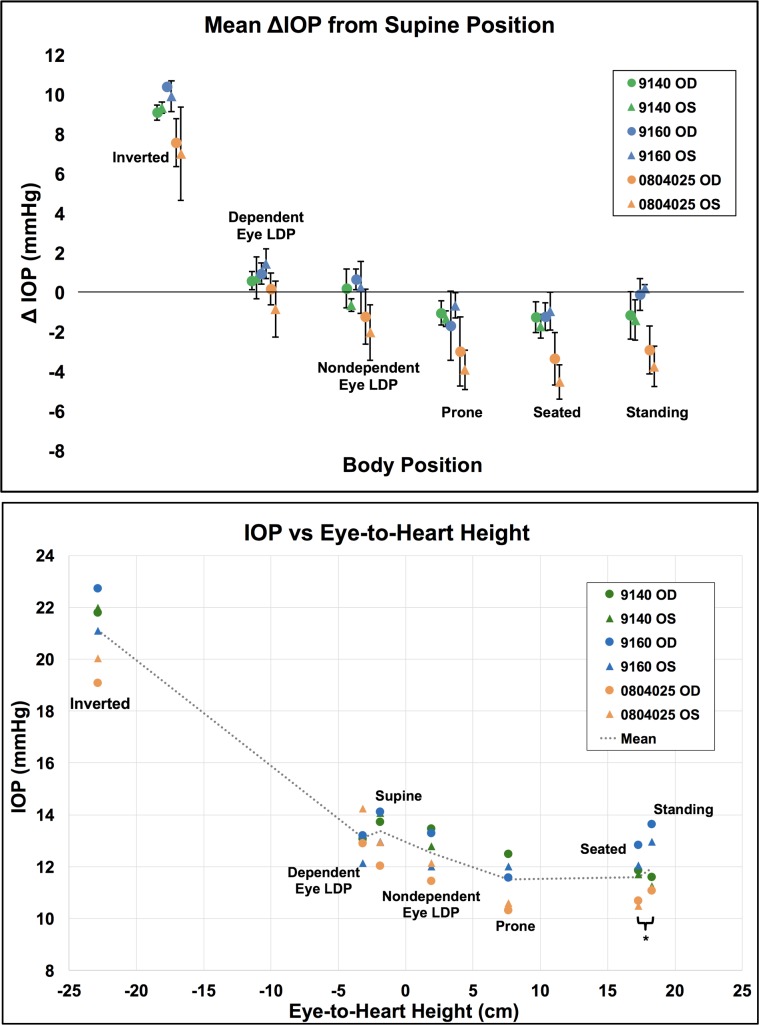
Figure 6.
Top: Mean IOP difference from supine position data for each eye (n = 6) by position. Error bars represent standard deviation. Bottom: Mean IOP per eye in each body position versus the approximate eye-to-heart distance for all NHP eyes (n = 6). Legend shows NHP ID and eye. *Seated and standing positions have identical eye-to-heart heights; data points are slightly offset for easier viewing.

