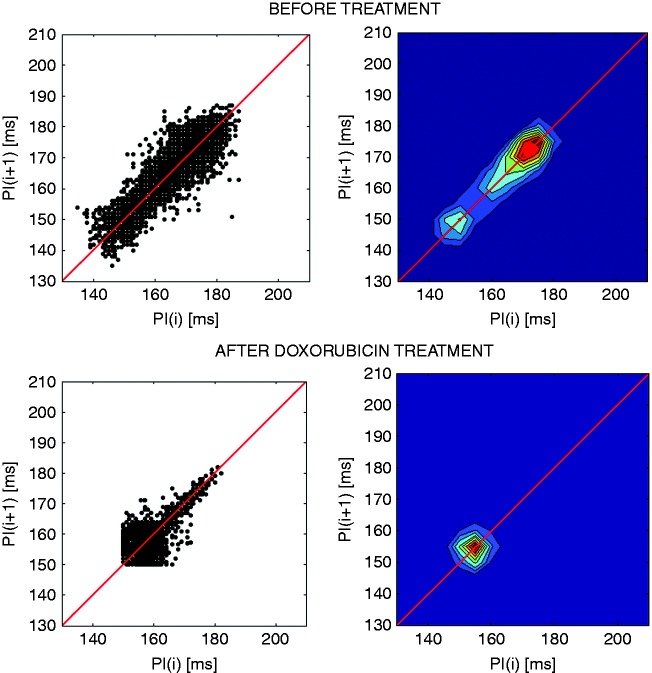
Figure 4.
Poincaré plots and the corresponding contour density plots of the heart rate (HR) in one rat before and after treatment with doxorubicin. Note the comet-shaped plot before treatment and the change of the shape after treatment due to a reduction of HR variability three days before fatal outcome. Source: reproduced with permission of D. Bajić.

