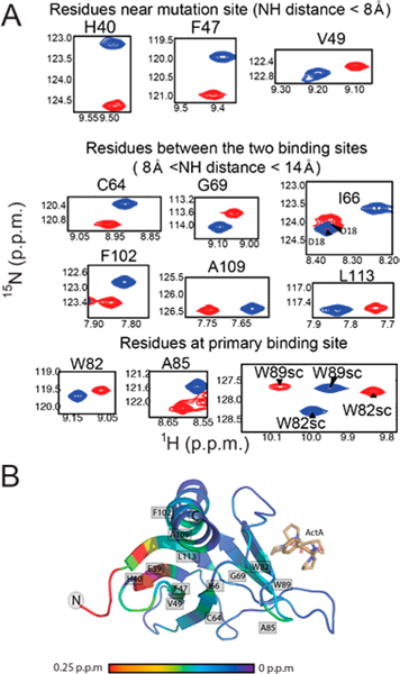
Figure 5.

1H–15N chemical shift differences between wild-type EVH1 and mutant Y39E. (A) Chemical shift differences between wild-type EVH1 (blue spectra) and EVH1 Y39E (red spectra). Both spectra were recorded under identical buffer conditions and with the same parameters. All highlighted residues display differences in chemical shift that exceed the error in chemical shift value by a factor of at least 10. (B) Mapping of 1H–15N backbone chemical shift differences to the EVH1 structure. Significant changes (>0.25 ppm) are represented by red, and no change is shown as purple.
