Figure 11.

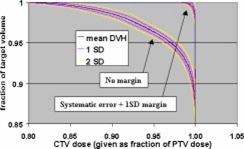
(Color) Mean DVH (blue), interval (pink), and interval (yellow) for 30 fractions with no margin and the systematic error plus one standard deviation margin.

(Color) Mean DVH (blue), interval (pink), and interval (yellow) for 30 fractions with no margin and the systematic error plus one standard deviation margin.