Figure 13.

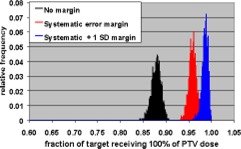
(Color) Histograms of target volume receiving 100% of PTV dose for 30 fraction treatment with no margin (black), systematic error margin (red), and systematic error plus one standard deviation margin (blue).

(Color) Histograms of target volume receiving 100% of PTV dose for 30 fraction treatment with no margin (black), systematic error margin (red), and systematic error plus one standard deviation margin (blue).