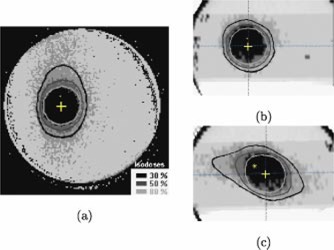
Figure 6.

(Color) (a) Axial, (b) coronal, and (c) sagittal relative dose images of PAG1 at isocenter. These images were obtained by binning the grayscale images shown in Fig. 4 into four relative dose regions: , and . The planned 30%, 50%, and 80% isodose contours are shown in each image. The cross indicates the isocenter.
