Figure 2.

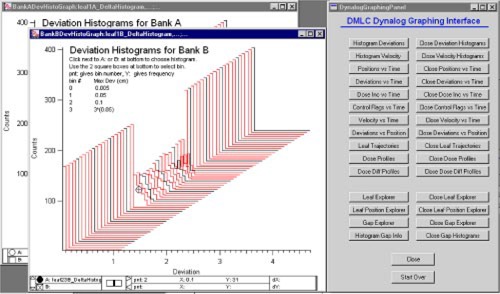
(Color) The Graphing Interface and the displays generated when the “Histogram Deviations” button is clicked. These types of displays show data for each leaf in each bank. Values may be obtained using the cursors at the bottom of the graph.

(Color) The Graphing Interface and the displays generated when the “Histogram Deviations” button is clicked. These types of displays show data for each leaf in each bank. Values may be obtained using the cursors at the bottom of the graph.