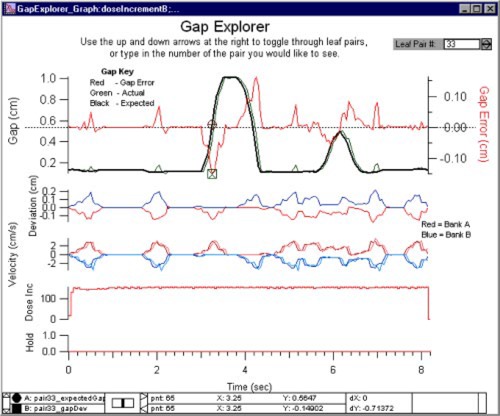
Figure 5.

(Color) The “Gap Explorer” display shows the desired and actual gap for a given leaf pair and the error in the gap. It also shows the deviation in position for each leaf, the desired and actual velocities of each leaf in the pair, the change in the dose fraction index, and the MLC beam hold‐off flag.
