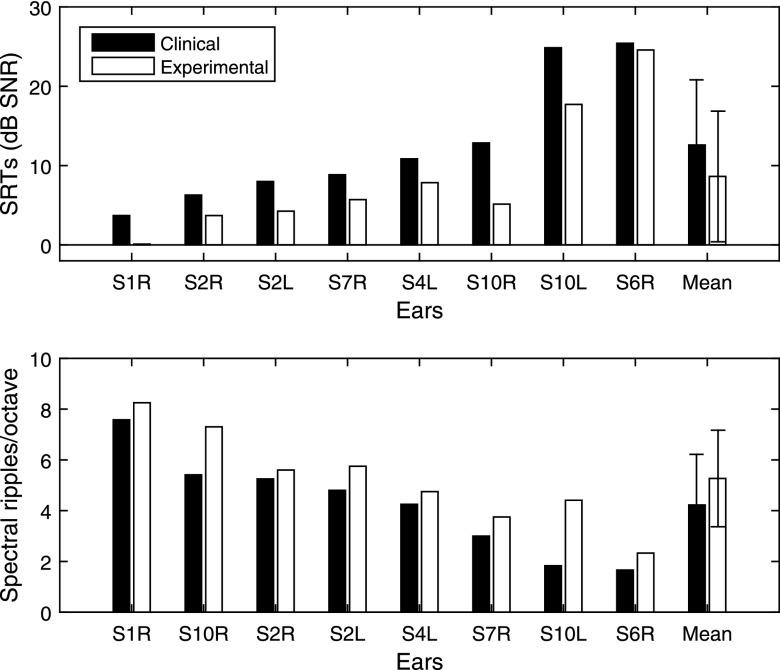
Fig. 2.
Speech reception and spectral ripple thresholds. Top panel: individual and group mean SRTs. Bottom panel: individual and group mean spectral-ripple discrimination thresholds. Performance measured using subjects' clinical map (before deactivation) is shown in black and performance measured using the experimental map with deactivation is shown in white. The thresholds were rank ordered based on the subjects' SRT scores with the clinical map (top panel black bars). Error bars represent standard deviation.

