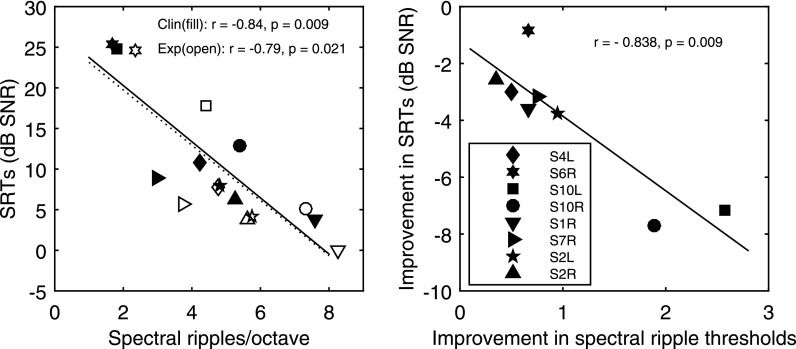
Fig. 3.
Correlations between SRTs and spectral-ripple discrimination thresholds. Symbols represent subjects and lines represent linear fit to the data. The left panel shows correlations between SRTs and the spectral-ripple discrimination thresholds before and after deactivation using the subjects' clinical (filled symbols and solid line) and experimental maps (open symbols and dashed line), respectively. The right panel shows the correlation between the improvement in SRTs and the spectral-ripple discrimination thresholds resulted from deactivation.

