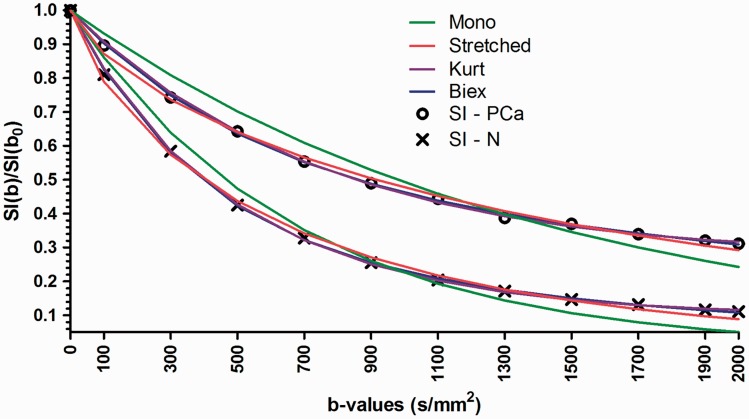
Fig. 11.
An example of signal decay in prostate cancer and normal tissue as a function of b-values (x-axis) fitted using the monoexponential, stretched exponential, kurtosis, and biexponential functions. Mono, monoexponential function; Stretched, stretched exponential function; Kurt, Kurtosis function; Biex, biexponential function; SI, signal intensity.

