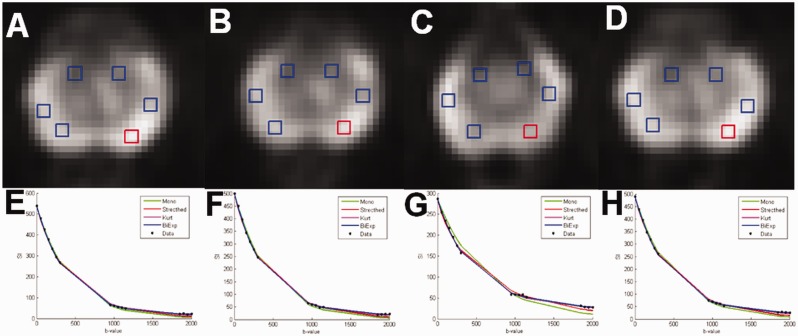
Fig. 8.
An example of four repeated DWI data acquisitions performed using an optimized b-value distribution for the biexponential function of one healthy volunteer with placement of ROIs (a–d). The DWI signal decay curve of mean signal intensity (SI) of ROI in red color is shown (e–h). Bi-exponential model has the smallest sum of squares of the vertical distance of the points from the curve (“fitting residuals”). Mono, monoexponential function; Stretched, stretched exponential function; Kurt, Kurtosis function; Biex, biexponential function; SI, signal intensity.

