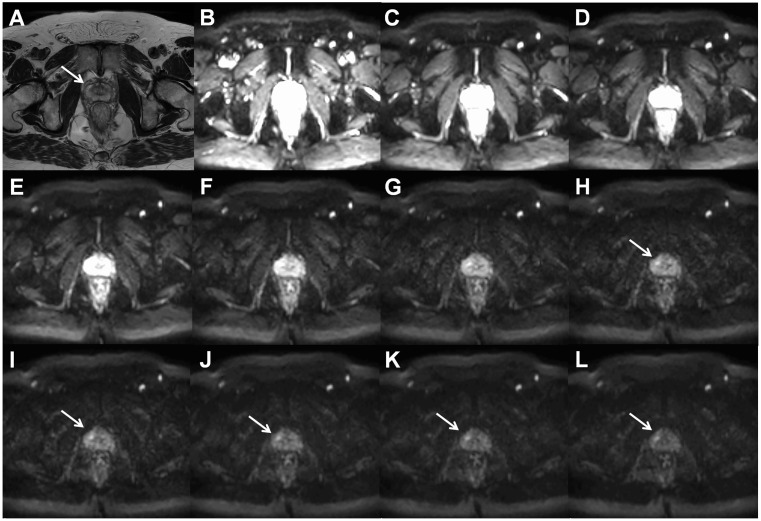
Fig. 9.
Axial T2W image ((a), arrow points to prostate cancer lesion) and trace DWI images of b = 0 (b), 200 (c), 400 (d), 600 (e), 800 (f), 1000 (g), 1200 (h), 1400 (i), 1600 (j), 1800 (k), and 2000 (l) s/mm2 of a patient with histologically confirmed Gleason score 4 + 3 prostate cancer demonstrate increasing contrast between the cancer lesion and benign tissue with increasing b-values. All trace DWI images have the same windowing setting. The MR acquisition protocol is provided in the Supporting Material (D_2000_b11.txt).

