Figure 3.

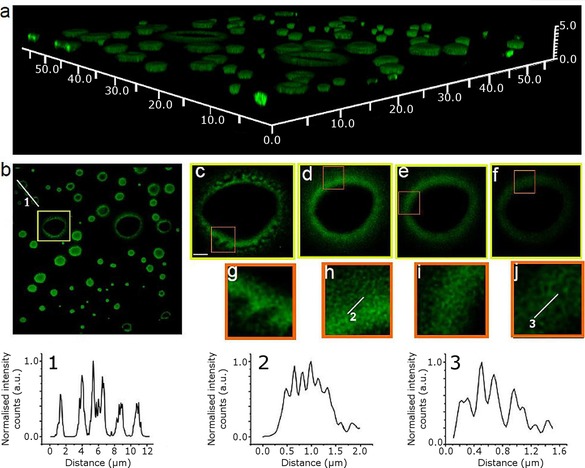
Stimulated emission depletion (STED) microscopy of a ZnII‐porphyrin (1) thin film (CHCl3 solution drying on a borosilicate glass surface); λ ex=488 nm, STED=775 nm, laser power intensity=179 mW, λ em=580 nm. Top image a) Deconvolved image of a 3D reconstruction obtained from stacked individual STED images. The image is shown in perspective for better appreciation of the different heights of the tubular structures. X, Y and Z scale bars: 50×50×5 μm). Below, from right to left, deconvolved image of the 3D reconstruction as projected in the XY plane (b). The line profile crossing 3 different tubes is shown in the graph below (1). The highlighted squared region in image (b) is magnified to the right; each image from left to right (c–f), is showing the same tubular structure at different z‐planes, with a difference between planes of 300 nm, c) being the lowermost region in contact with the surface, and f) the uppermost. Zoom‐in images of the squared regions can be found below each image (g–j). The lines profiles drawn in (h) and (j) are represented in the graphs (2) and (3), respectively.
