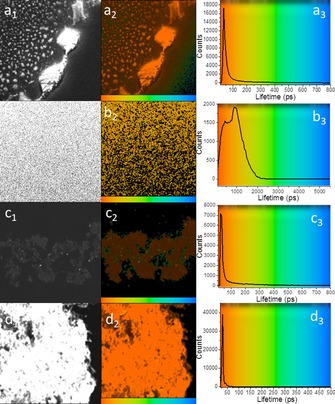
Figure 14.

Two‐photon fluorescence lifetime map (λ ex=810 nm) of a1, a2) microcrystalline free‐base porphyrin and associated lifetime profile distribution across the image (a3), b1, b2) microcrystalline ZnII‐porphyrin complex and associated lifetime profile distribution (b3), c1, c2) non‐covalent solid ZnII‐porphyrin@SWNTs complex (2) and corresponding lifetime distribution curve (c3) and d1, d2) solid covalent ZnII‐porphyrin@SWNTs complex (6) and corresponding lifetime distribution curve (d3). Images (a1, b1, c1, d1) are two‐photon‐intensity images. A colour‐coded bar is provided for direct correlation between the lifetime colour maps (a2, b2, c2, d2) and lifetime histograms (a3, b3, c3, d3).
