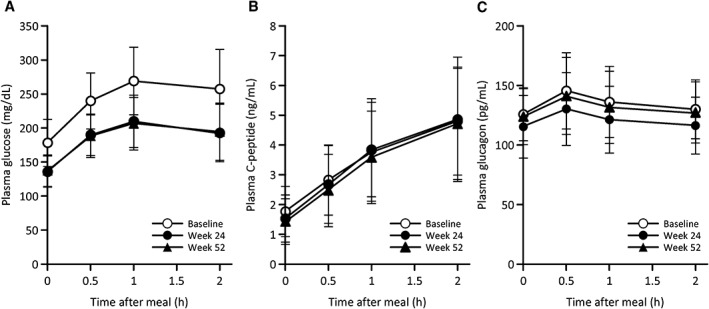
Figure 2.

Changes in A, blood glucose; B, C‐peptide and C, glucagon levels in the mixed‐meal tolerance tests at baseline, week 24 and week 52. Data represent mean ± standard deviation. Glucose: 1 mg/dL = 0.0555 mmol/L; C‐peptide: 1 ng/mL = 0.333 nmol/L; Glucagon: 1 pg/mL = 1 ng/L.
