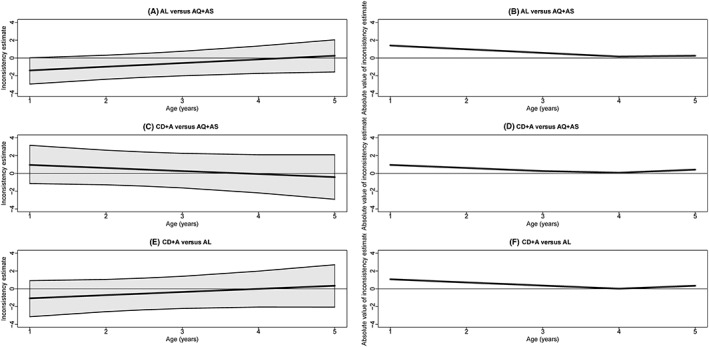
Figure 5.

Graphs showing, for each comparison, how the posterior median of the inconsistency estimate and its 95% credibility interval change with age (A, C, and E) and how the absolute value of the posterior mean of the inconsistency estimate changes with age (B, D, and F). AL indicates artemether‐lumefantrine; AQ + AS, amodiaquine‐artesunate; CD + A, chlorproguanil‐dapsone plus artesunate; DHAPQ, dihydroartemisinin‐piperaquine
