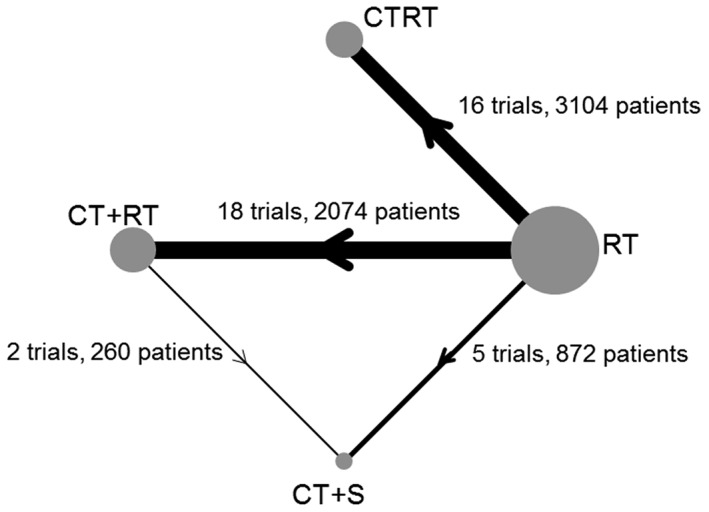
Figure 1.

Cervical cancer network diagram. Node size and edge thickness are proportional to the number of studies involved in each direct comparison. RT, radiotherapy; CTRT, chemoradiation, CT+RT, neoadjuvant chemotherapy plus radiotherapy; CT+S, neoadjuvant chemotherapy plus surgery. NB: the numbers for each treatment arm do not add up to the total number of patients included in the network as multiarm patients are counted twice. There are a total of 37 trials in this network; however, in the figure, the 2 multiarm trials are counted 3 times each as they are included in the number of trials for each pairwise comparison. Arrows denote direction of treatment comparison in NMA models (see Section 4.1)
