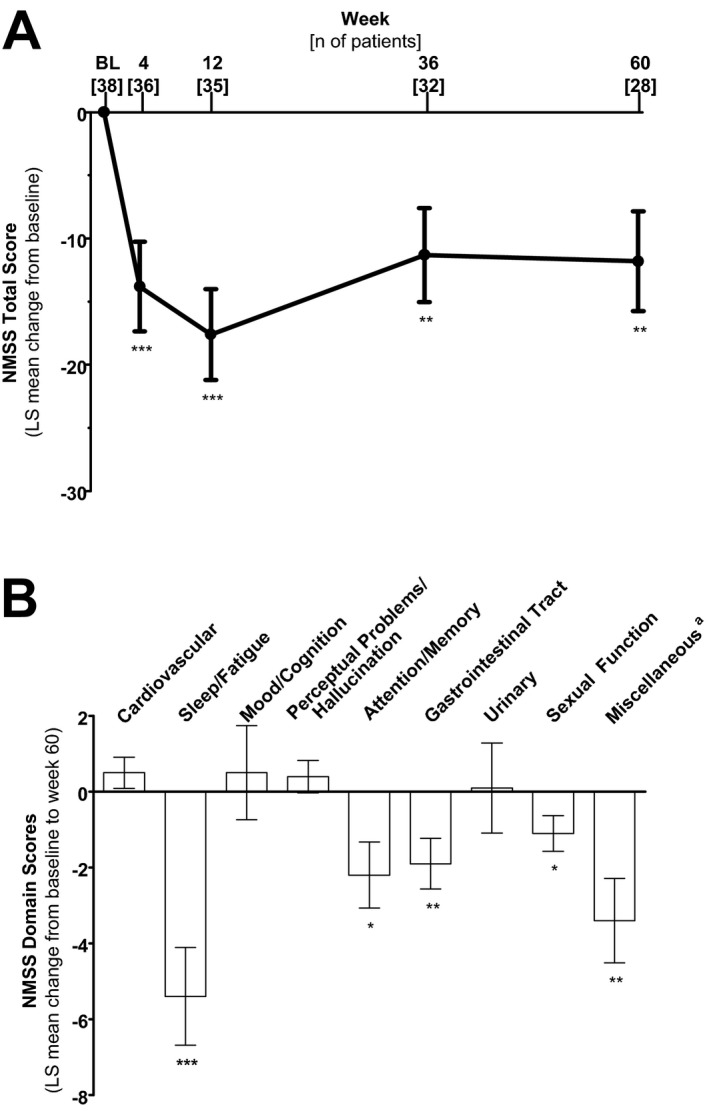
Figure 2.

(A) Least squares mean change from baseline in the NMSS total score and (B) Least squares mean change in the NMSS domain scores at week 60. At week 60, n = 28. Error bars indicate standard error. P‐values from a repeated measure model that included fixed effects of study site and visit, with baseline score as a covariate, and the baseline‐by‐visit interaction indicate statistically significant mean change from baseline scores of P < 0.05 (*), P < 0.01 (**) and P < 0.001 (***). Abbreviations: LS, least squares; NMSS, Non‐Motor Symptom Scale. aIncludes pain, taste/smell, weight, and excessive sweating.
