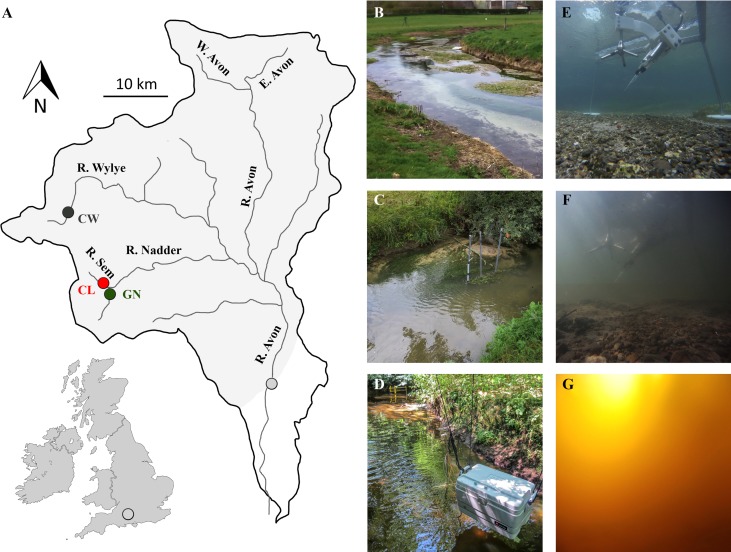
Figure 1.

River Avon catchment. (A) Overview of the River Avon catchment and tributaries relevant to this study (adapted from Jarvie et al. 2005a). The shaded area indicates the 1393.5 km2 area of upper River Avon catchment, i.e., the catchment upstream of 50° 58' 28.235'' N/1° 45' 15.233'' W (light gray dot). Red dot indicates the study site within the 25.58 km2 catchment of CL (51° 2' 43.170'' N/2° 6' 56.315''). Gray dot indicates the study site within the 50.04 km2 catchment of CW (51° 9' 23.231'' N/2° 11' 24.945'' W). Green dot indicates the study site within GN, 34.16 km2 catchment (51° 2' 34.611'' N/2° 6' 49.500'' W). (B–D) Overview of the stream morphology at the study site CW (B), GN (C), and CL (D). (E–G) AEC system deployed at the CW (E), GN (F), and CL (G). Note that the underwater camera was mounted on the AEC frame leg at the same distance from the ADV for each of the deployments.
