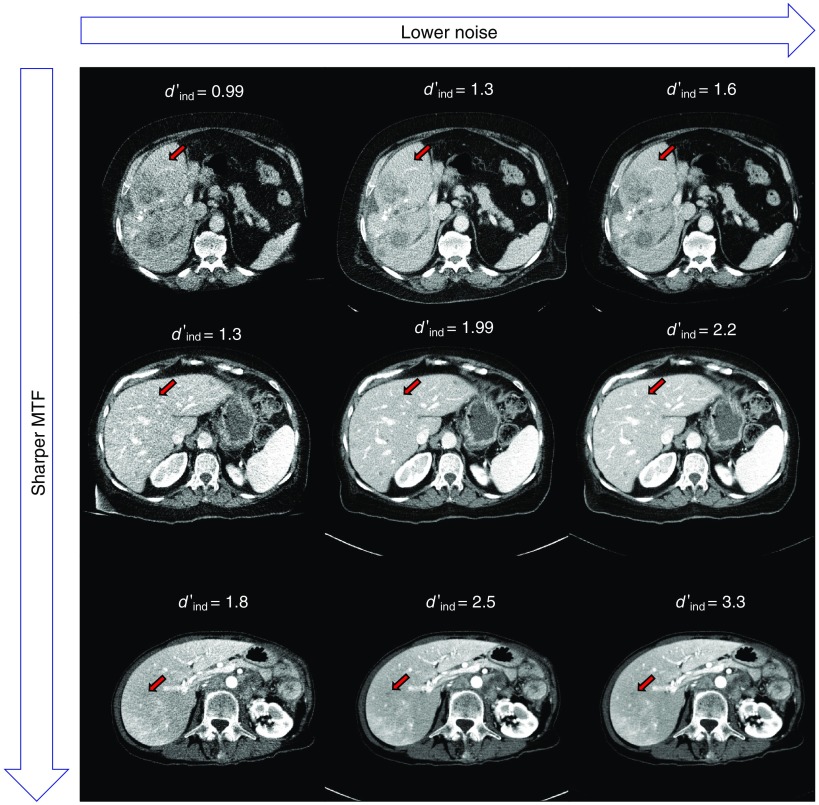
Fig. 2.
FBP reconstructions of three patient datasets at varying radiation dose levels. The image noise decreases along rows from right to left. The image sharpness increases along columns from top to bottom. The red arrow indicates the insertion of the desired task function to visually indicate the conspicuity of representative lesions in each dataset. Listed values are measurements for each of the corresponding slices.

