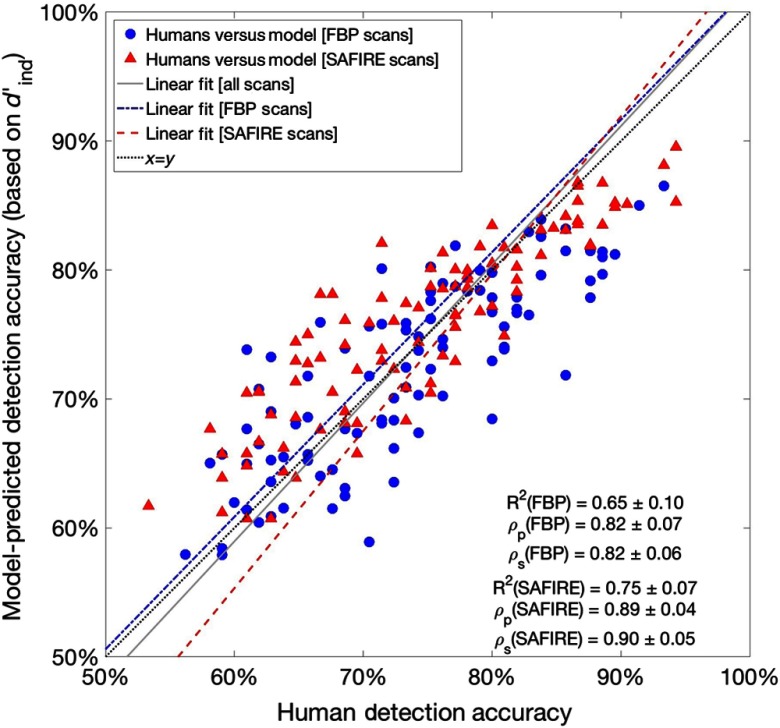
Fig. 3.
Comparison of observer study accuracy results and corresponding detectability index model-predicted accuracies. Listed Pearson and Spearman correlations and -squared values correspond to subsets of data as characterized by the dotted line, (denoting exact correspondence between predicted and observed detection accuracies). Shown linear fits are summarized in Table 2.

