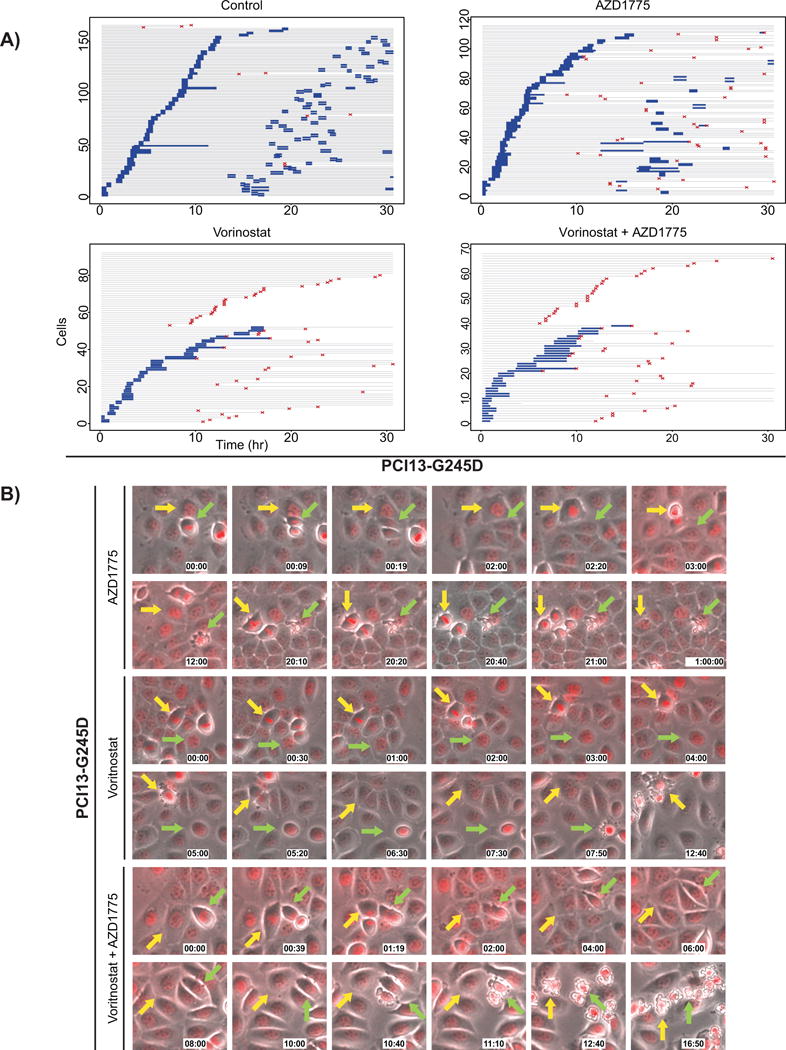
Figure 2. Multiple cell cycle perturbations lead to significant apoptosis in HNSCC cells expressing high-risk mutp53 treated with combination of vorinostat and AZD1775.

Histone-H2B-RFP expressing PC13-G245D cells were treated with the drugs as indicated and followed by live cell imaging. A, live cell imaging results depicted as event charts, where each line represents one cell where the cell’s time in interphase is labeled gray, its time in mitosis is labeled blue, and the time of apoptosis is marked by a red symbol. B, Representative image frames from the live cell imaging movies illustrating mitotic and interphase events leading to apoptosis.
