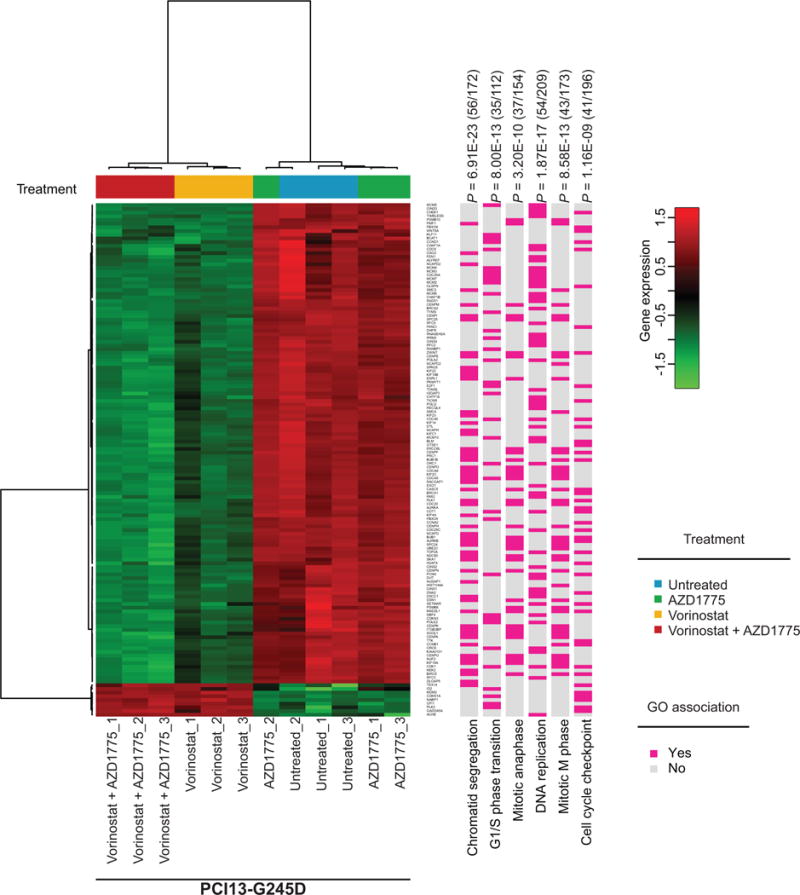
Figure 5. HDAC and WEE1 inhibition affects key genes involved in DNA replication and G2/M cell cycle checkpoint in TP53 mutant HNSCC.

TP53 mutant PCI13-G245D cells were treated with either vorinostat, AZD1775 alone or in combination for 48 hours and subjected to RNA-seq analysis as described in Methods. Shown is a hierarchical clustering heatmap associated with the target GO terms representing the distribution of the significant 139 differentially expressed genes (DEGs) identified by RNA-seq profiling and their specific cell functions. Red and green colors indicate increased or decreased gene expression levels, respectively. P-values are shown and fractional numbers (in parenthesis) on top indicate the DEGs from the list of 139 DEGs that are linked to a cell function (bottom and pink boxes) divided by the total number of genes listed for the function by GO enrichment.
