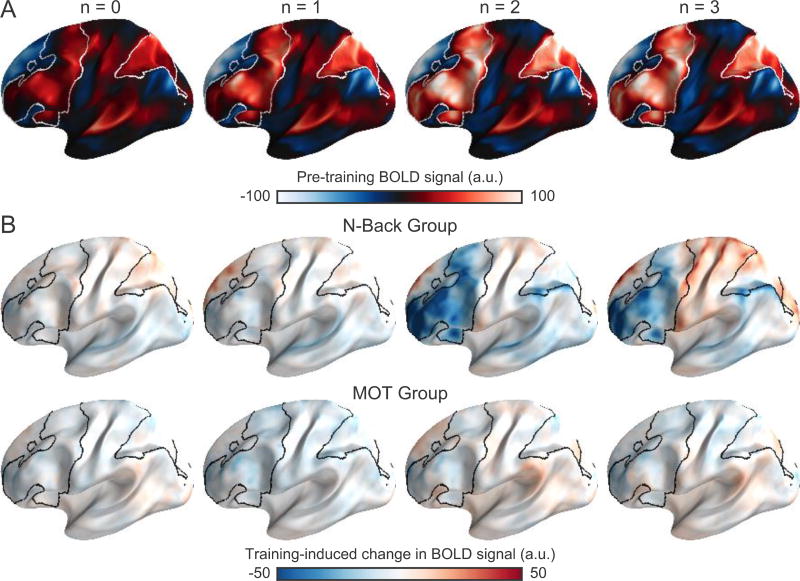
Figure 5.
Only the N-Back Group exhibited reductions of activation after training in the 2-back and 3-back conditions. (A) Mean BOLD signal, relative to baseline. (B) The mean difference between pre- and post-training BOLD signal (changes from implicit baseline) is shown for each n-back level for N-Back Group (top row) and MOT Group (bottom row). In both panels, the outlines correspond to the extent of activations identified using a parametric analysis as shown in Figure 3.

