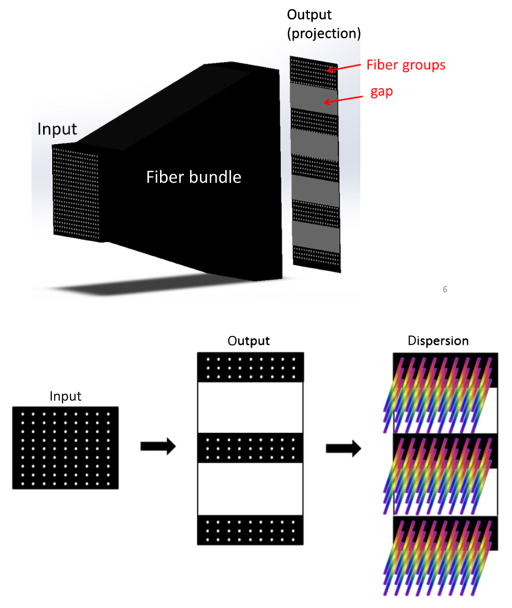
Fig. 1.
Fiber bundle design and image collection schematic. At the input end, fibers are organized in a regular matrix presented at the left-hand side of the figure. At the output end, fibers are organized into multiple groups separated by gaps. The void spaces in between the individual fibers are filled with spectral data objtained using prism. Because image plane include both spatial and spectral information, we can acquire complete (x, y, λ) datacube in a single snapshot.

