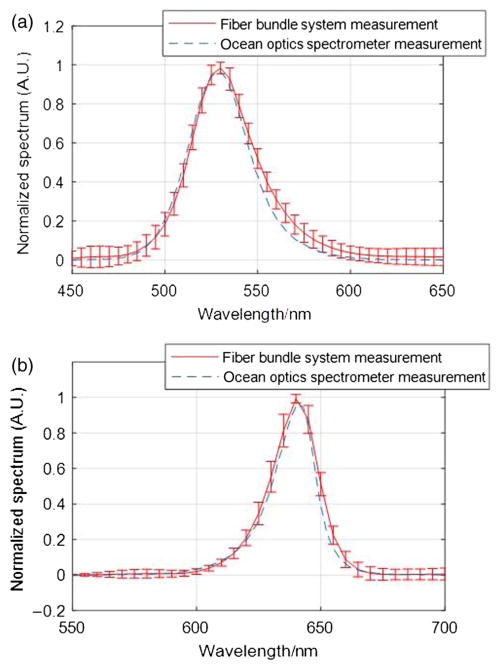
Fig. 12.
(a) Comparison of the emission spectrum of a M530L3 LED measured by the light-guide snapshot spectrometer system (red line with error bars) and an ocean optics spectrometer (dotted line). (b) Comparison of the emission spectrum of a M625L3 LED measured by the light-guide snapshot spectrometer system (red line with error bars) and an ocean optics spectrometer (dotted line).

