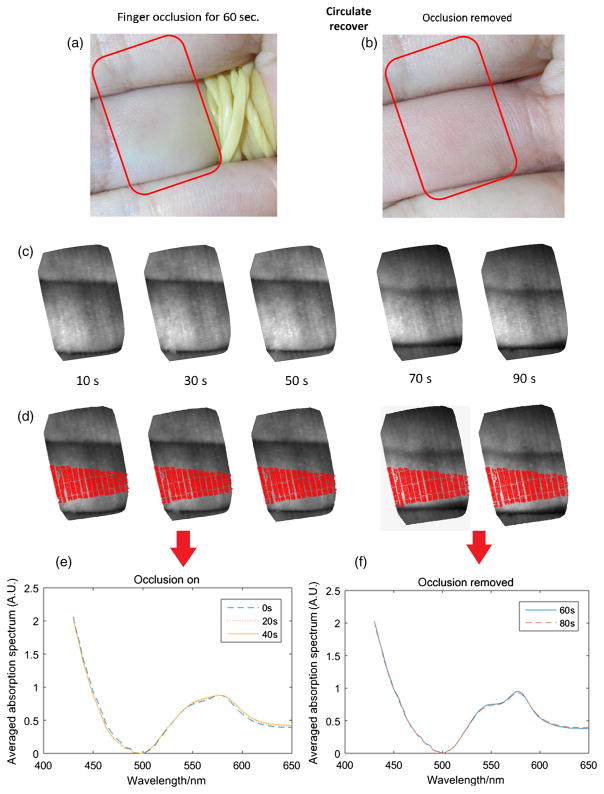
Fig. 13.
Illustration of the finger occlusion experiment. (a) The artery in one finger is occluded with a rubber band (RGB reference camera image). The area imaged by the fiber bundle is indicated by the red rectangle. (b) The rubber band was removed after 60 s. (c) Reconstructed single channel image (600-nm wavelength) from our imaging spectrometer at 10, 30, 50, 70, and 90 s. (d) The red area indicates the central area where the averaged absorption spectra were calculated. (e) The calculated average spectrum of the occluded finger (10, 30, and 50 s). (f) The calculated average spectrum of the finger after occlusion removal (70 and 90 s).

