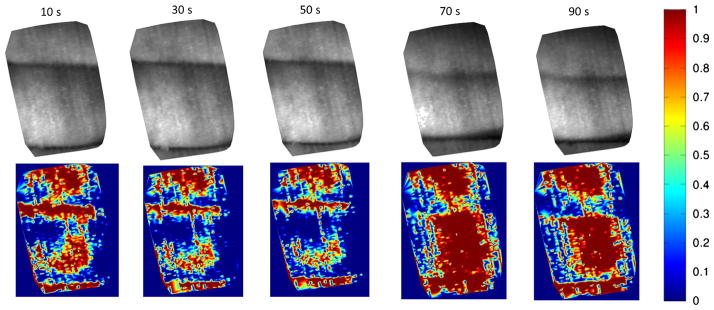
Fig. 14.
Color-mapped O2 saturation images reflecting the finger oxygen saturation changes during the occlusion experiment. For the first three images, the saturation value fades with increasing time. For the last two images, the oxygen saturation value displayed a sudden rapid increase and then a slight decay.

