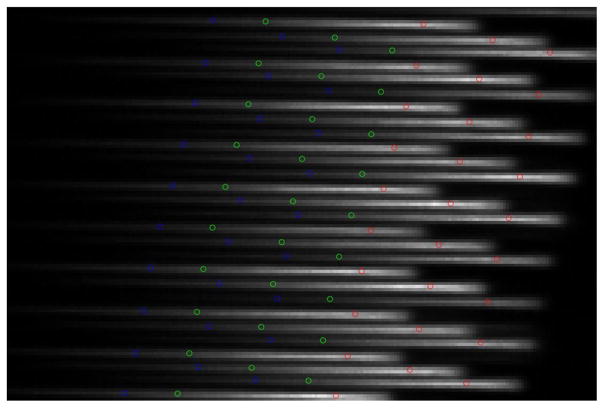
Fig. 9.
A portion of the raw flat-field image captured by the CCD detector superimposed by the positions of spot centroids from the 488-, 514.5-, and 632.8-nm filters in the spectral calibration procedure. On the raw flat-field image, light from individual fiber cores was dispersed into lines. For spectral calibration, we used three 1-nm filters to obtain three single-channel flat-field images which are marked with blue (488.0 nm), green (514.5 nm), and red (632.8 nm) dots on the figure.

