
Fig 1. Visualizing translocations.
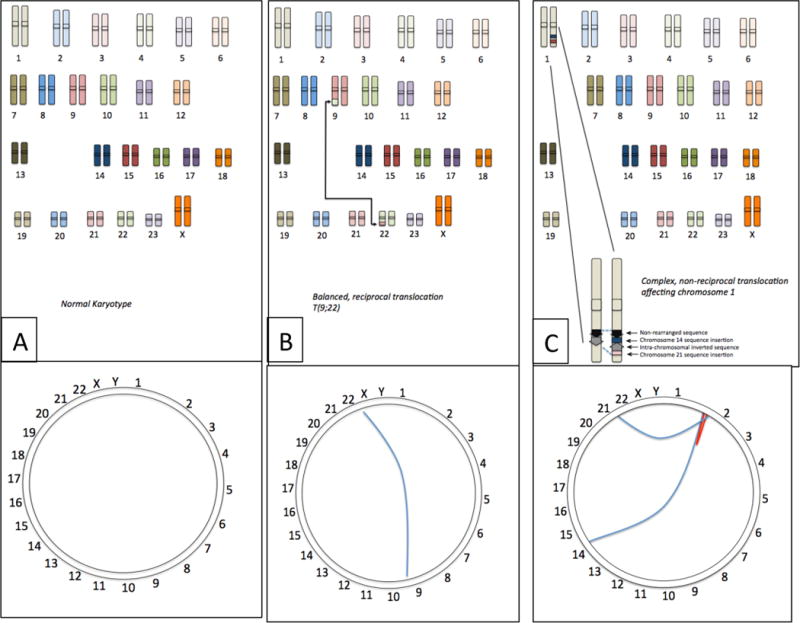
(A) The normal human chromosome set contains no rearrangements between chromosomes. The Circos plot18 shows this as a ring with the uninterrupted sequence of the chromosome running around the circumference. (B) Certain cancer cells contain balanced, reciprocal translocations, which join sequence from different chromosomes, such as the T(9;22) translocation from CLL, which exchanges sequence from chromosomes 9 and 22. Viewed as a Circos plot, this translocation can be visualized as a line connecting the breakpoints of the translocation on chromosomes 9 and 22. (C) Many translocations are more complex rearrangements involving multiple chromosomes. In this example, chromosome 1 contains a rearrangement involving translocated sequence from chromosomes 14 and 21, and an internal sequence inversion. Such complex translocations can be pictured using the Circos plot, where the blue lines indicate interchromosomal translocations and the red line shows the intra-chromosomal inversion.