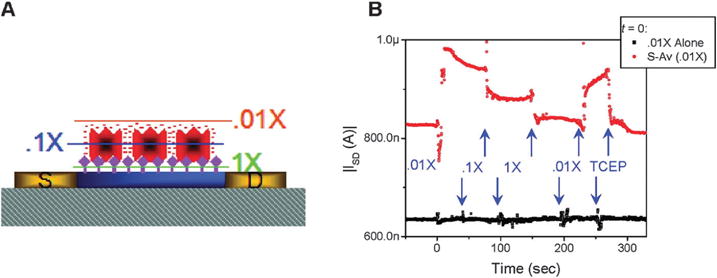
Fig. 4.

Effect of buffer dilution on sensor response from Stern et al. ref. 108, (A) represents the schematic structure of FET device using nanowire with different Debye length. The blue bar represents the active region of the device, the yellow regions the leads ((S) source, (D) drain), the gray hashed region the underlying oxide, the purple diamonds are biotin, and the red objects are streptavidin, (B) is the sensor response. Copyright Nano Letters, American Chemical Society.108
