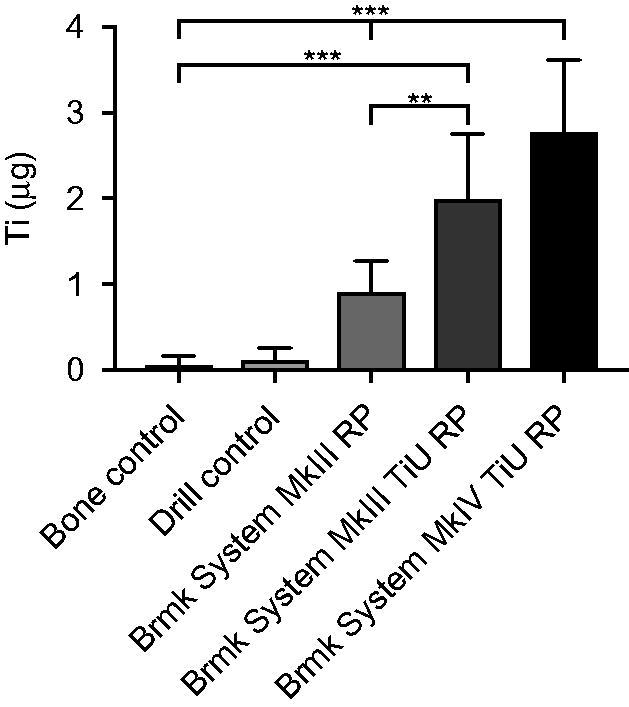
Figure 3.

Titanium (Ti) release during insertion of the tested implants. Mean Ti-content (µg) ±SD (n = 61) found in the bone samples with ICP-AES analysis are shown in the bar chart. Kruskal-Wallis H test with a Dunn’s test for multiple comparisons against bone control and between the tested implants with a significance level of p < .05. **p = .01 and ***p < .001.
