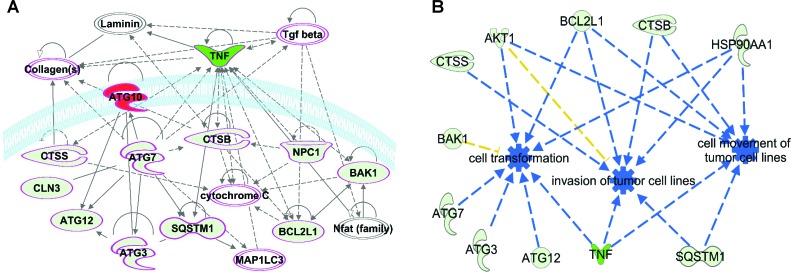
Figure 5. SIRT6 modulated autophagy-related genes appear to be involved in cancer and are predicted to play roles in cell transformation, tumor invasion and movement of tumor cells.
(A) A network pathway showing regulatory interactions among 12 of the 17 genes modulated ≥2-fold upon SIRT6 knockdown was generated using IPA. Pink boundaries indicate involvement of those genes in cancer. Gene-gene interactions are indicated by arrows, solid lines denote robust correlation with partner genes, and dashed lines indicate statistically significant but less frequent correlations. Upregulated genes after SIRT6 knockdown are represented in red color whereas downregulated are shown in green. Uncolored nodes indicate genes not tested in the RT-qPCR array. (B) IPA was further used to explore the functions of SIRT6-modulated genes. The functional annotations leading to inhibition are denoted with blue dotted lines. Findings inconsistent with the state of downstream molecules are represented with the dark yellow dotted lines.

