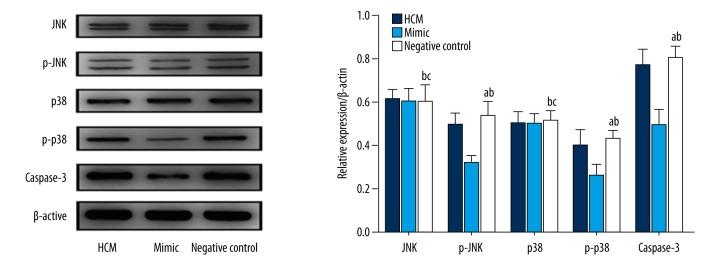
Figure 5.
Effect of miRNA-21 expression on the expression of MAPK signaling pathway proteins and caspase-3 protein. (1) HCM group: HCM cells without any treatment; (2) Mimic group: HCM cells transfected with miRNA-21 mimic shRNA; (3) Negative control group: HCM cells transfected with negative control shRNA; (4) a Shows that there was a statistically significant difference compared with mimic group (P<0.05). (5) b Shows that there was no significant difference compared with HCM group (P>0.05). (6) c Shows that there was no significant difference compared with mimic group (P>0.05).

