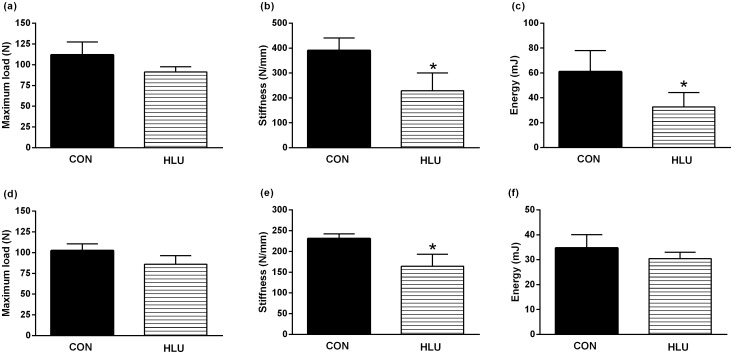
Fig 6. Biomechanical test parameters.
Ex vivo maximum load (a, d), stiffness (b, e), and absorbed energy to maximum load (c, f) data of the femoral neck, assessed by the biomechanical compression bending testing (top) and data of the femoral midshaft assessed by the three-points bending testing (below). Statistical analysis was performed with the Mann Whitney test to compare the hindlimb unloading (HLU) group to the control (CON) group * (P < 0.05).

