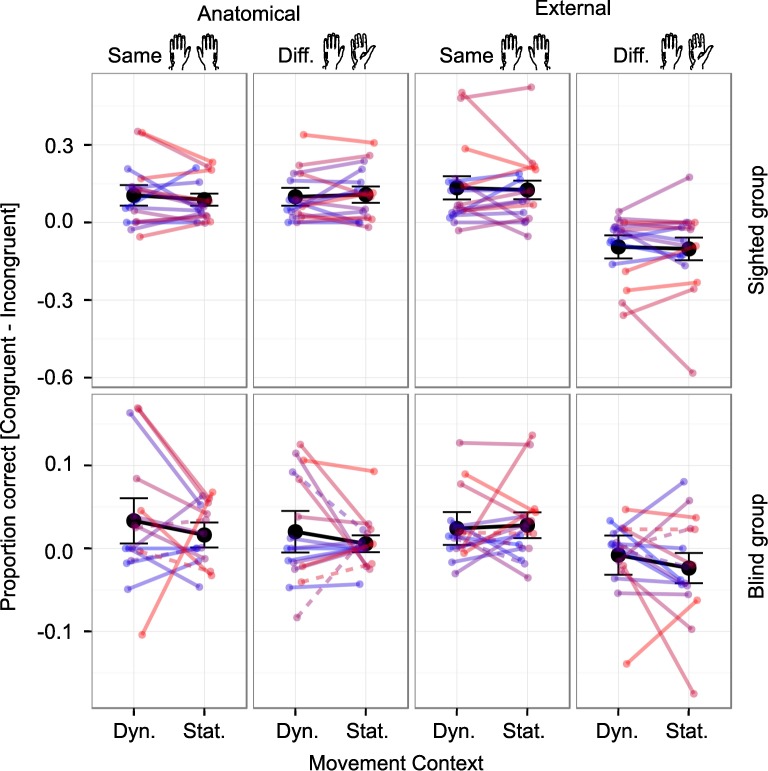
Fig 3. Individual participants’ tactile congruency effects in proportion correct.
Response proportions from anatomically incongruent trials were subtracted from response proportions in congruent trials. Congruency effects are plotted for dynamic (“Dyn.”) and static (“Stat.”) contexts with hands held in the same (1st and 3rd column) and in different orientations (2nd and 4th column) under anatomical (1st and 2nd column) and external instructions (3rd and 4th column) in the sighted (top row), and in the congenitally blind group (bottom row). Note that scales differ between groups, reflecting the smaller congruency effects of the blind as compared to the sighted group. Mean congruency effects for each condition are plotted in black, whiskers represent SEM. Each color represents one participant.

