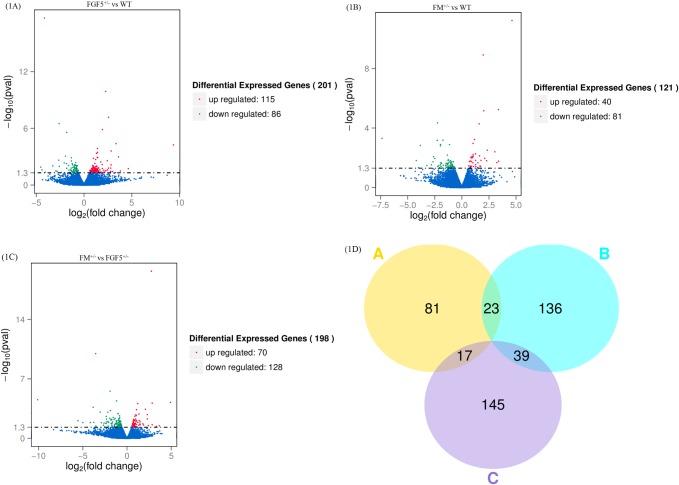
Fig 1. Differentially expressed genes in the RNA-Seq data.
Volcano plot of statistically significant differentially expressed genes at P ≤ 0.05 identified from the RNA-Seq libraries of normal and transgenic goat muscle (1A, 1B, 1C). A Venn diagram showing the DEGs identified from comparisons of FGF5+/- vs WT goats, FM+/- vs WT goats and FM+/- vs FGF5+/- goats (1D).

