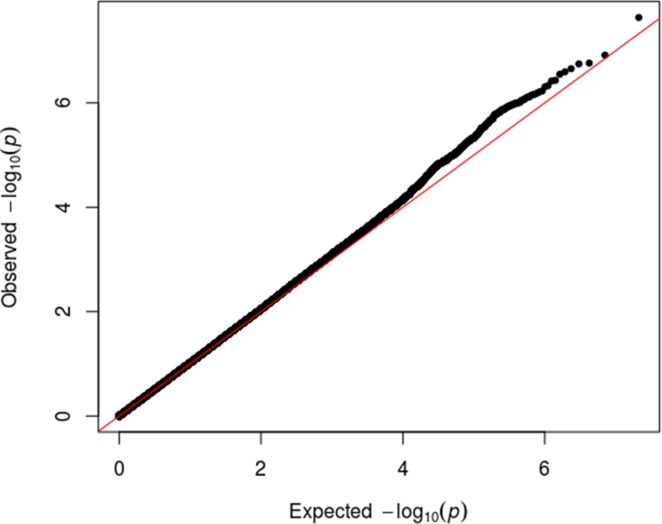
Fig 1. Quantile-quantile plot for genome-wide association analyses of rotator cuff injury.
The expected versus observed log transformed values for the 10,582,947 p-values are graphed. The observed p-values (black dots) are plotted on the y-axis and the p-values expected by chance (red line) are plotted on the x-axis.

