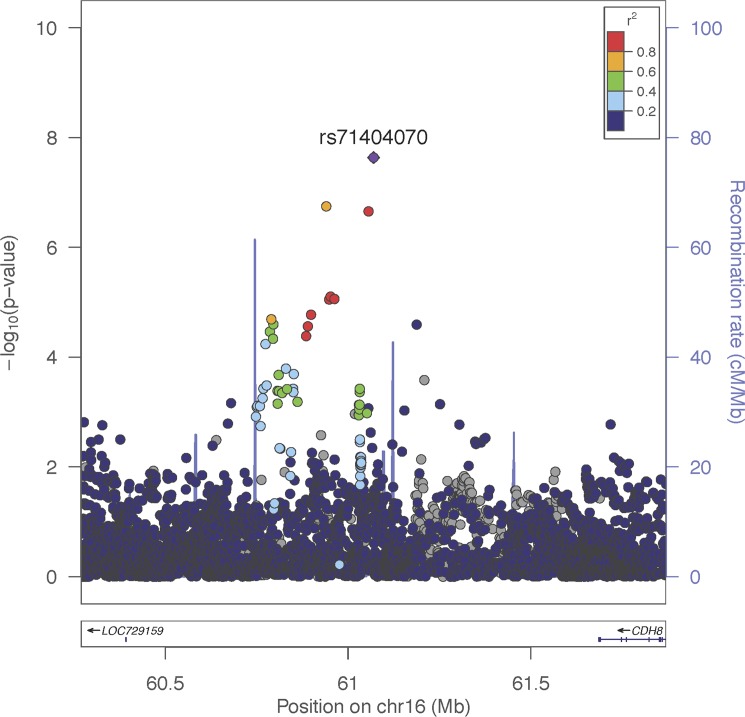
Fig 4. Regional-association plot for rs71404070 with rotator cuff injury.
Tested SNPs are arranged by genomic position on chromosome 16 (x-axis) in a 2Mb window around the lead SNP rs71404070, including the locus where our association signal is present. The y-axis indicates -log10 p-values for association with rotator cuff injury for each SNP. The top group of SNPs are located in the intergenic region between LOC729159 and cadherin8 (CDH8). The purple diamond represents the lead SNP rs71404070. The color of dots representing flanking SNPs indicates their linkage disequilibrium (R2) with the lead SNP as indicated in the heat map color key. The grey dots represent SNPs that lack R2 information in 1000genomes or HapMap. Blue vertical lines show the recombination rate at specific genomic positions and approximate locus boundaries.

