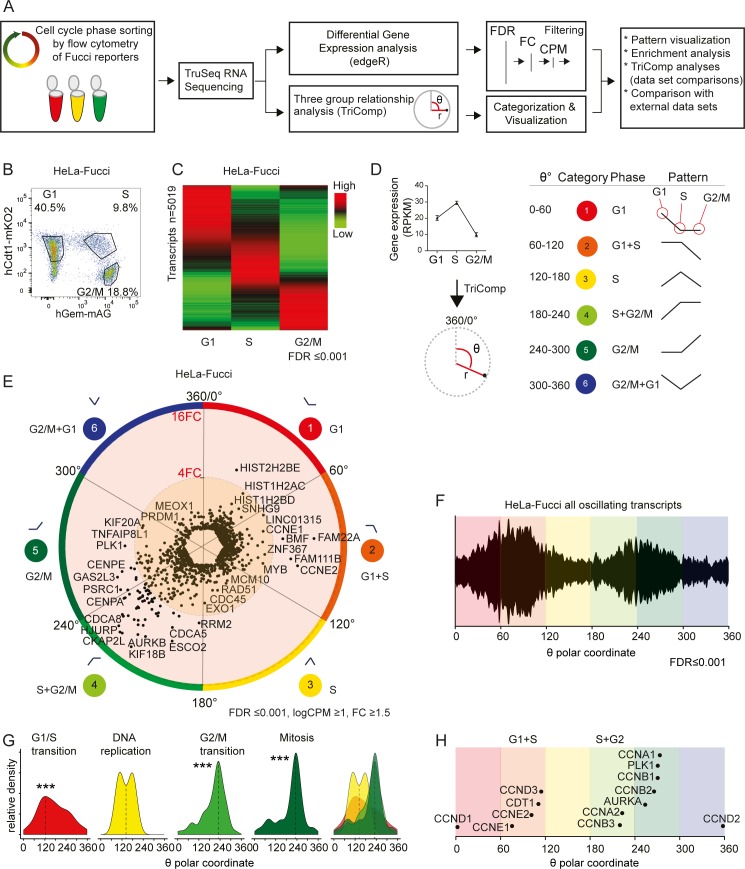
Fig 1. Visualization of transcripts oscillating with the cell cycle reveals expression patterns.
(A) The scheme of the experimental and analytical workflow. (B) HeLa-Fucci cells were sorted into three restricted cell cycle phases, G1, S, and G2/M, according to the expression of Fucci markers. (C) A heat map analysis shows differential gene expression patterns in sorted HeLa-Fucci cells. (D) For each individual transcript in the HeLa-Fucci transcriptome, the TriComp algorithm was used to calculate polar coordinates (θ, r). θ denotes the relationship between gene expression levels in the three cell cycle phases, and r denotes the intensity of this relationship. Genes with similar expression patterns were divided into six categories (6x60°) based on their θ-value. (E) Polar coordinates for all transcripts found to oscillate significantly in synchrony with the cell cycle (FDR≤0.001, logCPM ≥1, FC ≥1.5) in sorted HeLa-Fucci cells show an unequal distribution. (F-H) θ-values describing the distribution of relationship patterns of oscillation for all significantly oscillating transcripts in HeLa cells (FDR≤0.001) (F), transcripts belonging to GO terms associated with the cell cycle (H), and common cell cycle markers (G). Significance stars denote the probability of arising from the same distribution as the full set of significantly oscillating transcripts using log-likelihood-ratio statistical comparison with a six-group binning (***: p < 0.001).

