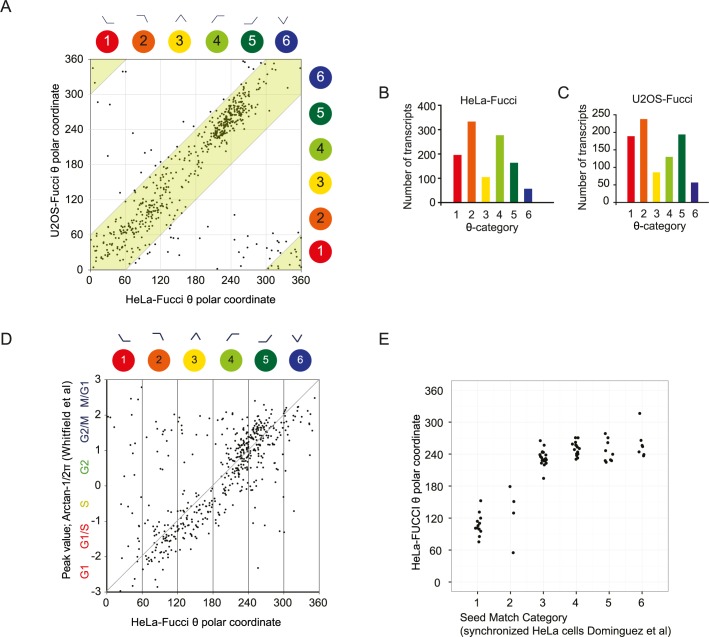
Fig 2. Comparisons of different cell cycle data sets show consistent expression patterns.
(A) Comparative analysis of HeLa-Fucci and U2OS-Fucci cell cycle-dependent transcriptomes after plotting their respective θ-value for each shared transcript (stringency level: FDR≤0.001). The green area denotes a correlation of less than 60 degrees in the θ-value. (B, C) Number of transcripts in each of the six TriComp θ-categories (FDR≤0.001). (D) Plot of the θ-value for HeLa-Fucci transcripts versus the reported phase peak value for each probe reported by Whitfield et al.[19]. (E) Category distribution plots for the core set of 67 genes reported by [18] versus the θ-value for genes significantly oscillating (FDR≤0.001) in HeLa-Fucci cells.

