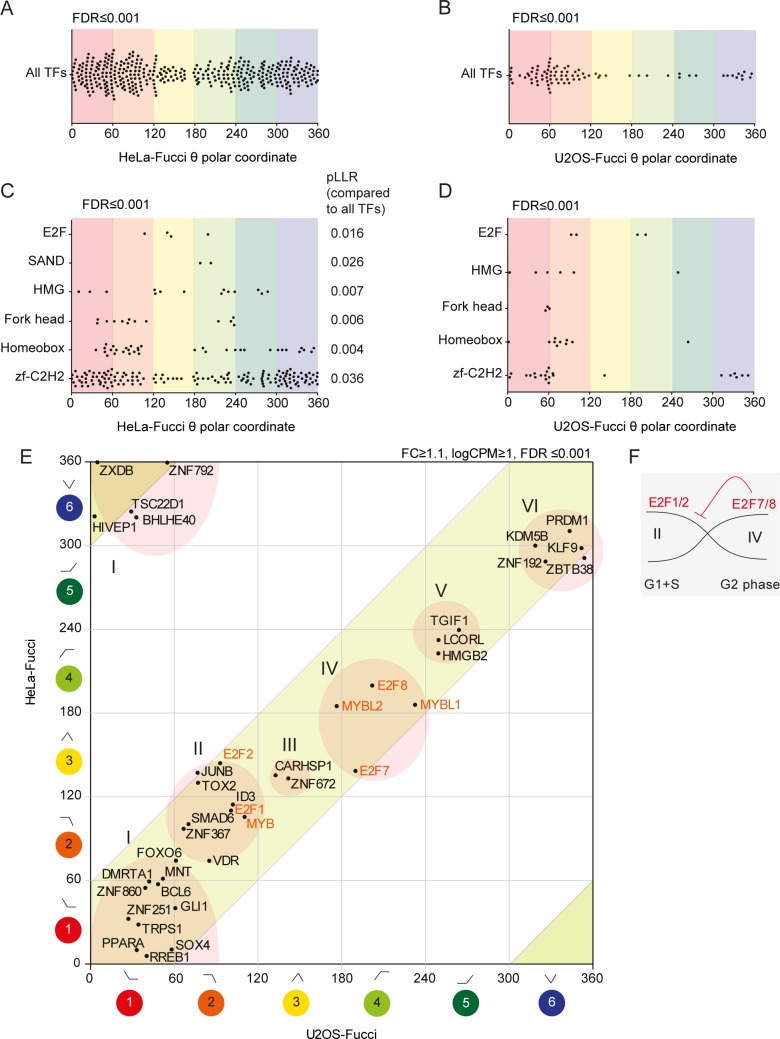
Fig 3. Large TF families oscillate and show differential distribution during the cell cycle.
(A-D) θ-value plots for all TFs and TF families with a significantly differing pattern in (A, C) HeLa-Fucci cells and (B, D) U2OS-Fucci cells (FDR ≤0.001; logCPM ≥1; FC ≥1.5). (E) θ-value plot of cell-cycle-synchronized TFs in HeLa-Fucci cells versus U2OS-Fucci cells, with suggested phase-specific expression groups denoted I-VI and the main TFs involved in G1 restriction and onset of S phase indicated in red. (F) Schematic showing how repressor activity may shape transcriptional boundaries during the cell cycle, exemplified by E2F7/8 repression of E2F1/2 expression.

