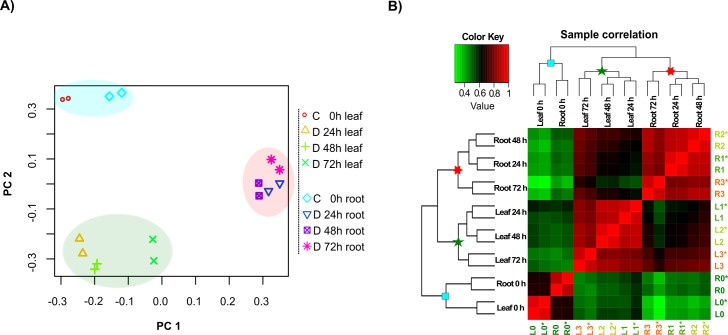
Fig 4. Correlation of sample replicates and hierarchical clustering analysis of gene expression levels in each sample (0, 24, 48, and 72 h) under osmotic stress treatment.
A) Sample relatedness is plotted using the first two principal component (PCs) showing the variability between replicates and different treatments. Non-stressed leaf and root samples are in blue shade background. In dark-green and in red background colors are the samples corresponding to stressed leaves and roots (24, 48, 72 h ASI), respectively. C = control, D = Drought. B) Correlation dendrogram of gene expression in all samples. Correlation r values are coded into key colors where green indicates lower r values; reds indicates higher r above the mean. Blue squares in the nodes represent non-stressed samples, green stars represent leaf stressed samples, and the red stars represent root stressed samples. L = leaf, R = root, L0 and R0 = non-stress treatment, L1 and R1 = 24 h treatment ASI, L2 and R2 = 48 h treatment ASI, L3 and R3 = 72 h treatment ASI. * = biological replicate.

