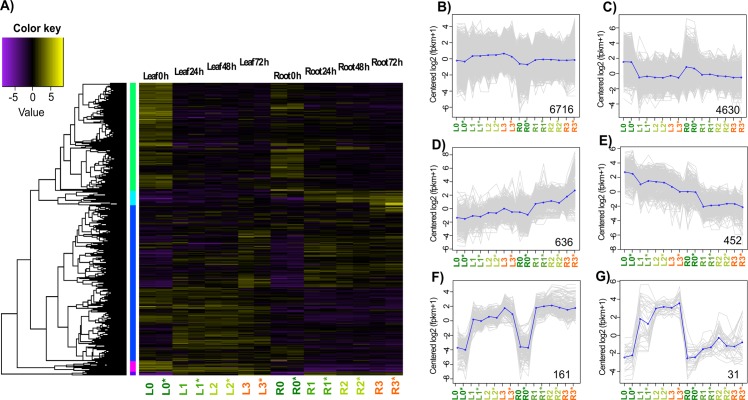
Fig 5. Correlation and clustering analysis of the sugarcane DEGs subjected to osmotic stress treatments.
A) Tissue-specific heatmap clustering of 12,662 significant DEGs (FDR ≤ 0.001 and FC ≥2) for the 0, 24, 48, and 72 h treatments ASI. B-G) Osmotic stress DEG profiles for the organ specific behavior clusters. Clusters were built according to their expression patterns during the stress treatments. Gray lines indicate the behavior of each gene into the treatment and the mean expression profile for each cluster is plotted as blue lines. Bottom number indicates the number of time series genes. L = leaf, R = root. L0 and R0 = non-stress treatment, L1 and R1 = 24 h treatment ASI, L2 and R2 = 48 h treatment ASI, L3 and R3 = 72 h treatment ASI. * = biological replicate.

