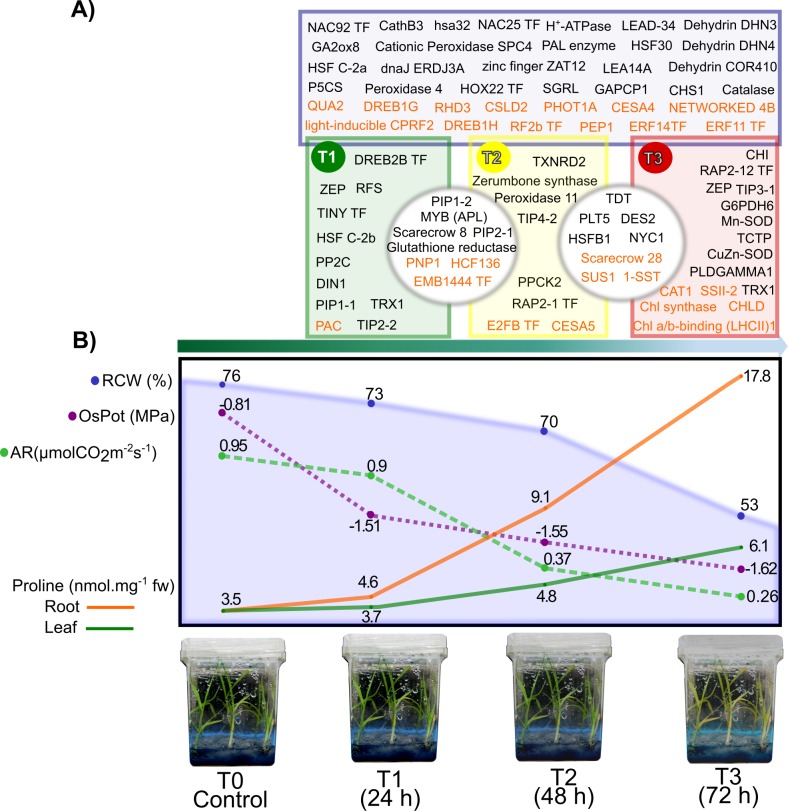
Fig 9. Principal findings of the analysis of sugarcane transcriptome under osmotic stress.
A) Genes regulated under osmotic stress treatments. Inside blue square are the DEGs regulated in the three treatments. The green square represents the DEG regulated only in the T1 treatment, within the yellow square are the DEGs expressed only in T2 treatment, and within the red square are the DEGs regulated only in T3 treatment. Inside gray circles are DEGs shared among treatments. Letters in black color represent the up-regulated DEGs and letters in orange color represent the down-regulated DEGs per treatment. B) Schematic depiction of the physiological results obtained in sugarcane var. Mex 69–290, imposed to an osmotic stress treatment by PEG 8000 for 24, 48, and 72 h. The green arrow under the depiction indicates the directions of the time-stress treatments. RCW = relative content water, OsPot = osmotic potential, AR = assimilation rate. Complete name of the genes in A) are listed in the S4 File.

