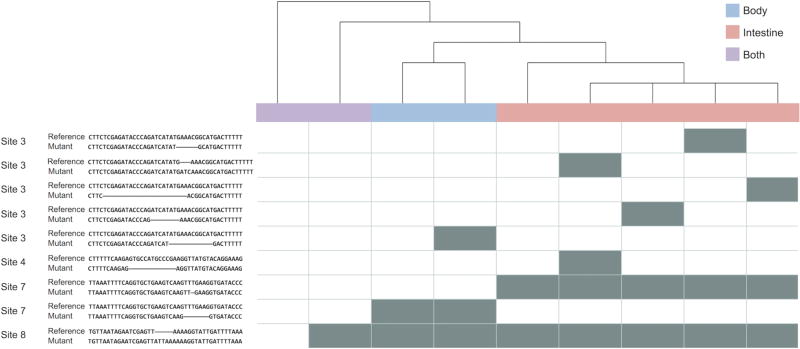
Figure 4.
Dynamic sequence barcoding identifies distinct cell populations. The relationships between a subset of unique sequence barcodes derived from the body (blue), intestine (red), and both samples (purple) of a single worm was used to create the following lineage tree. The barcodes corresponding to each member of the tree are presented in the columns of the heatmap, the individual indels are denoted by its rows, and each gray-shaded box indicates the presence of a given indel. The indels are presented in the table to the left of the heatmap as alignments between the reference (top) and observed (bottom) sequences, and the cut site with which each signature is associated is listed in the leftmost column of the table.

