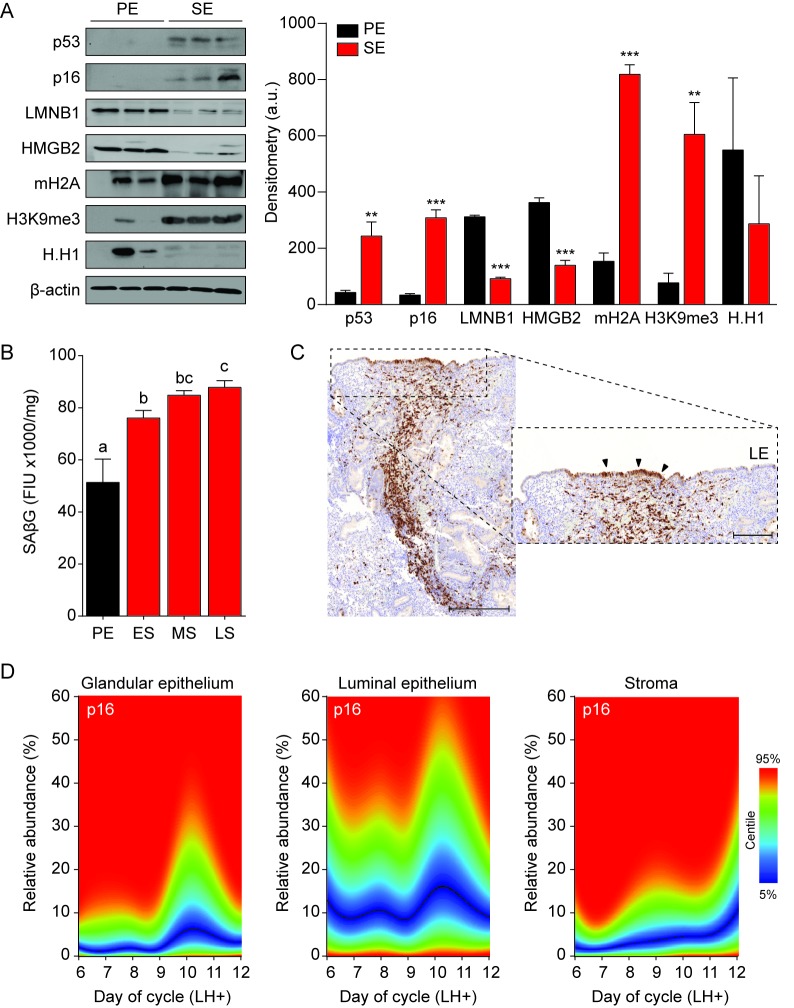
Figure 2. Senescent cells in cycling human endometrium.
(A) Left panel: representative Western blot analysis of p53, p16, LMNB1, HMGB2, mH2A, H3K9me3 and H.H1 levels in whole tissue biopsies from proliferative endometrium (PE) and secretory endometrium (SE). β-actin served as a loading control. Right panel: protein levels quantified relative to β-actin by densitometry and expressed as arbitrary units (a.u.). (B) SAβG activity, expressed in fluorescence intensity units (FIU)/mg protein, was measured in biopsies from proliferative endometrium (PE; n = 7), early-secretory (ES; n = 9), mid-secretory (MS; n = 38) and late-secretory (LS; n = 19) endometrium. (C) Immunohistochemistry demonstrating distribution of p16+ cells in the stromal compartment and luminal epithelium. Scale bars = 200 µm. (D) The abundance of p16+ cells during the luteal phase in glandular epithelium, luminal epithelium and stroma compartment was analyzed by color deconvolution using ImageJ software in 308 LH-timed endometrial biopsies (average 48 samples per time point; range: 22 to 69). The centile graphs depict the distribution of p16+ cells across the peri-implantation window in each cellular compartment. Color key is on the right. Data are mean ±SEM of 3 biological replicates unless stated otherwise. **p<0.01, ***p<0.001. Different letters above the error bars indicate that those groups are significantly different from each other at p<0.05.

