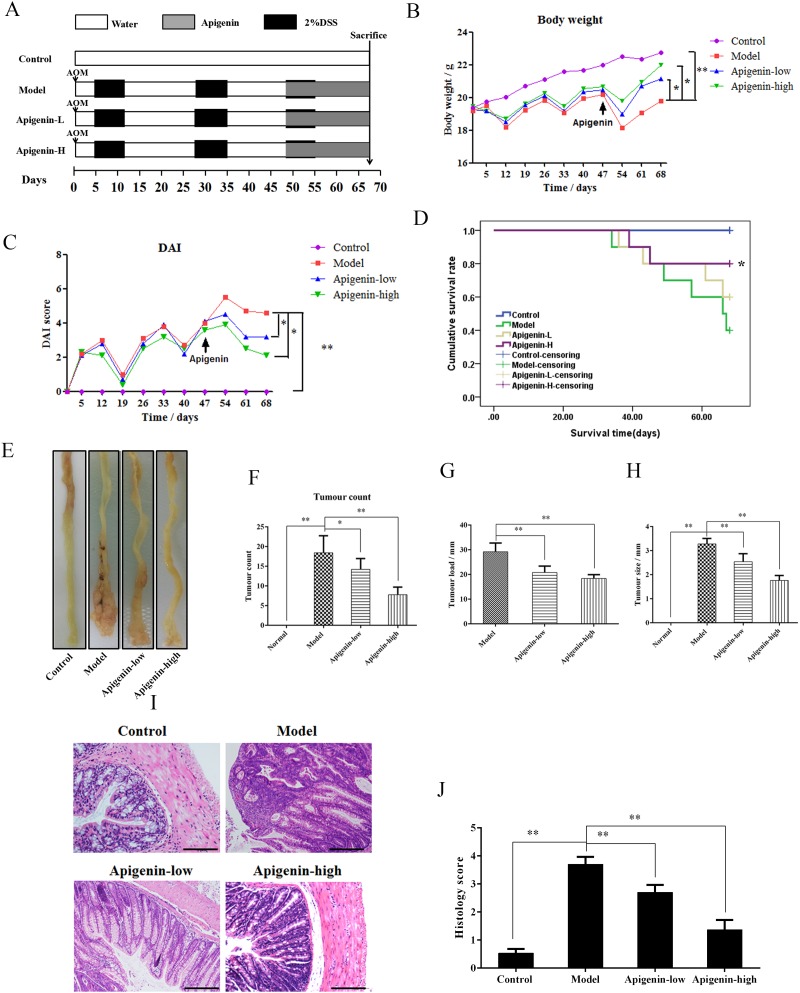
Figure 3. Apigenin protects against CAC in mice.
(A) Mouse model of AOM/DSS-induced CAC. (B) Body weights (g) of CAC mice. (C) DAI values of CAC mice. (D) Survival curves for each group. (E) Colon morphology of each group. (F–H) Tumor count, tumor load, and tumor sizesfor each group, respectively. (I and J) Photographs of pathologic colon sections from each group and associated colon histological scores, respectively. Data are presented as means of three experiments; error bars represent standard deviation (*P < 0.05, **P <0.01).

